BackLLM Monitor.
Next.js Dashboard — Case Study

LLM Monitor.

Chat With Your GPU Server — And Let It Deploy

A self-hosted Next.js dashboard fronted by an AI ops agent: ask it in plain language to check health, restart containers, or pull the latest code from GitHub and rebuild — it proposes the exact command, waits for your password, then streams the real output back. Behind it sits 24/7 GPU and system monitoring, LLM benchmarks, and token accounting.

16
Agent Tools
12
Features
24/7
Collector
Telegram
Alerts
ControlConversationalEvery writeHuman-approved
Scroll down
(01)Feature

AI Ops Agent

Talk to the server in plain language — the agent picks the right tool and answers with real data
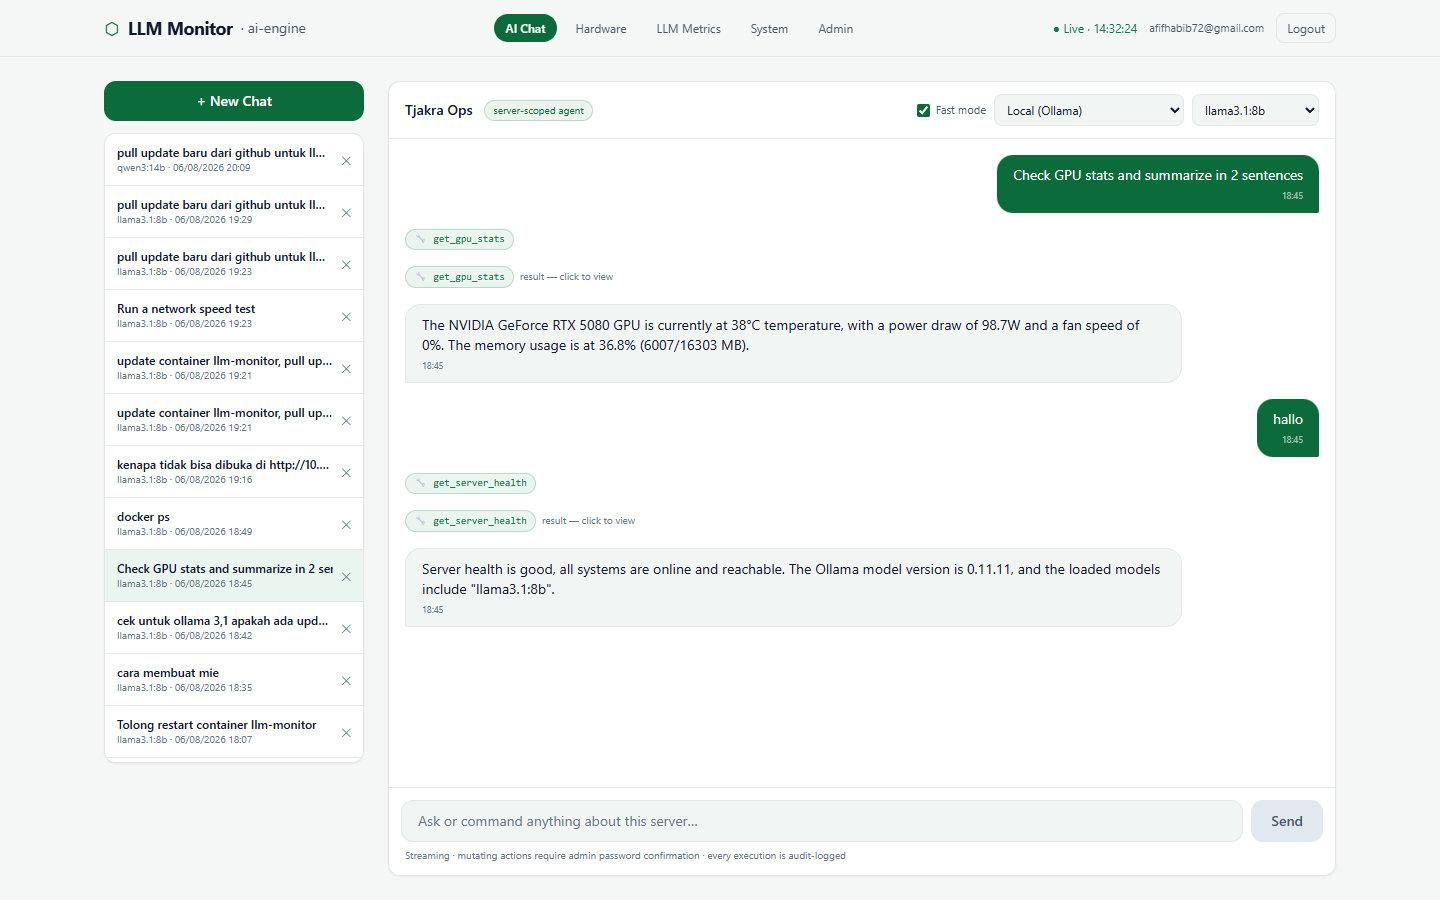
16 tools covering health, GPU, system, alerts, containers, logs, models and networking
Runs on local Ollama models or an external API — switchable per conversation
Answers stream token by token, with a Fast mode that skips chain-of-thought
Reasoning is split out of the reply and tucked behind a collapsible block
Conversations persist server-side, so history survives a reload
monitor.ai-engine/chat
AI Ops Agent
(02)Feature

Deploy & Container Control

Ask it to ship the latest code — it pulls from GitHub, rebuilds, and recreates the containers
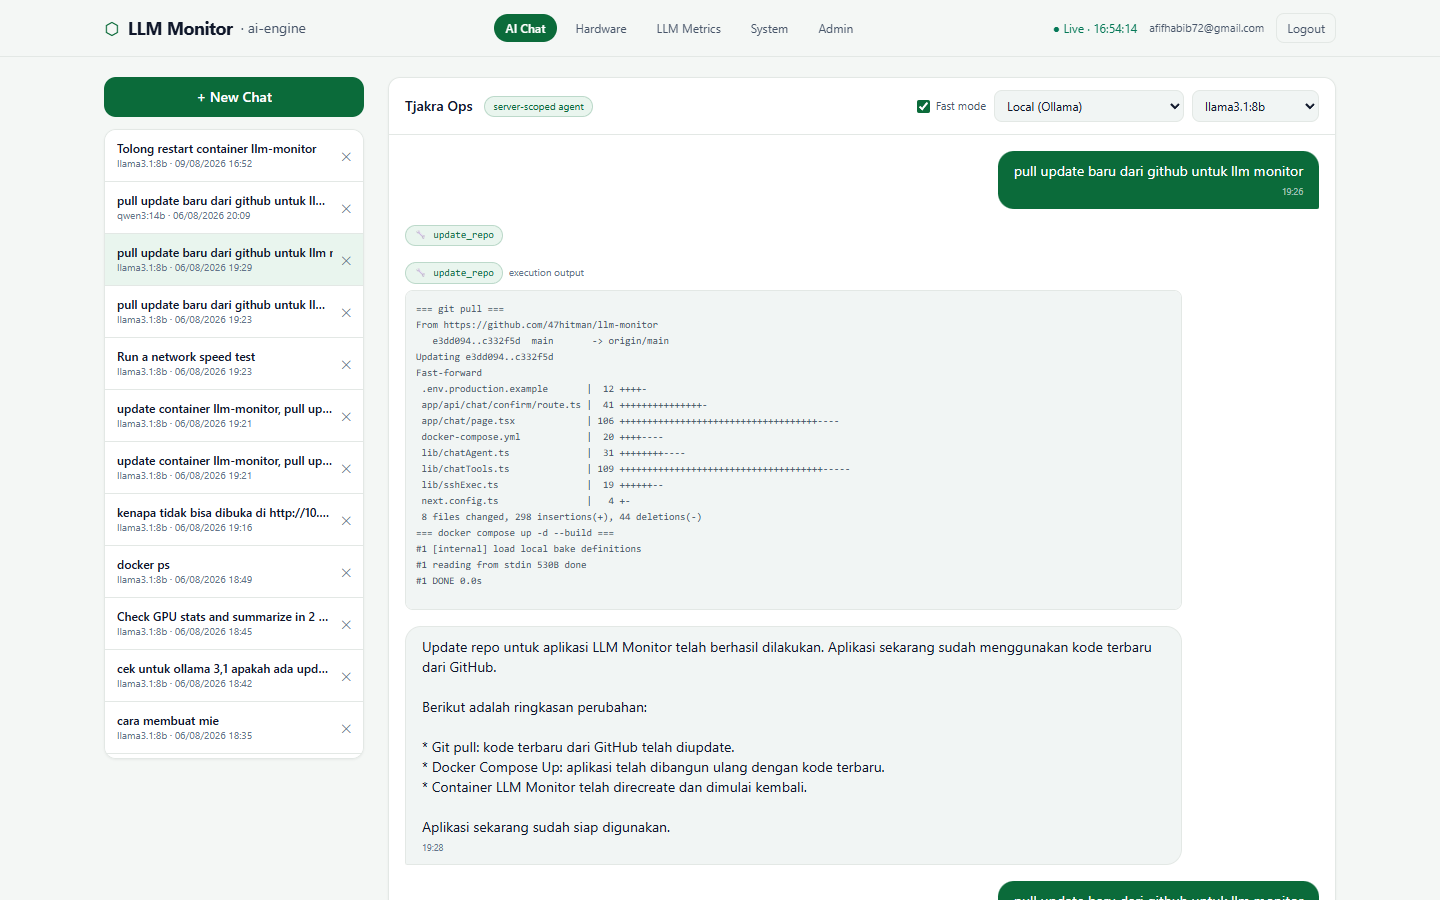
"Pull the update from GitHub" runs git pull + docker compose up -d --build
The full git diff and build log stream straight back into the chat
Start, stop or restart any container by name
Repo names are resolved server-side against what actually exists — no invented paths
Long deploys run as tracked jobs, so progress survives closing the tab
Anything without a dedicated tool still runs as a confirmed shell command
monitor.ai-engine/chat
Deploy & Container Control
(03)Feature

Approval Gate & Audit Trail

The agent can propose destructive work, but a human always signs off before it runs
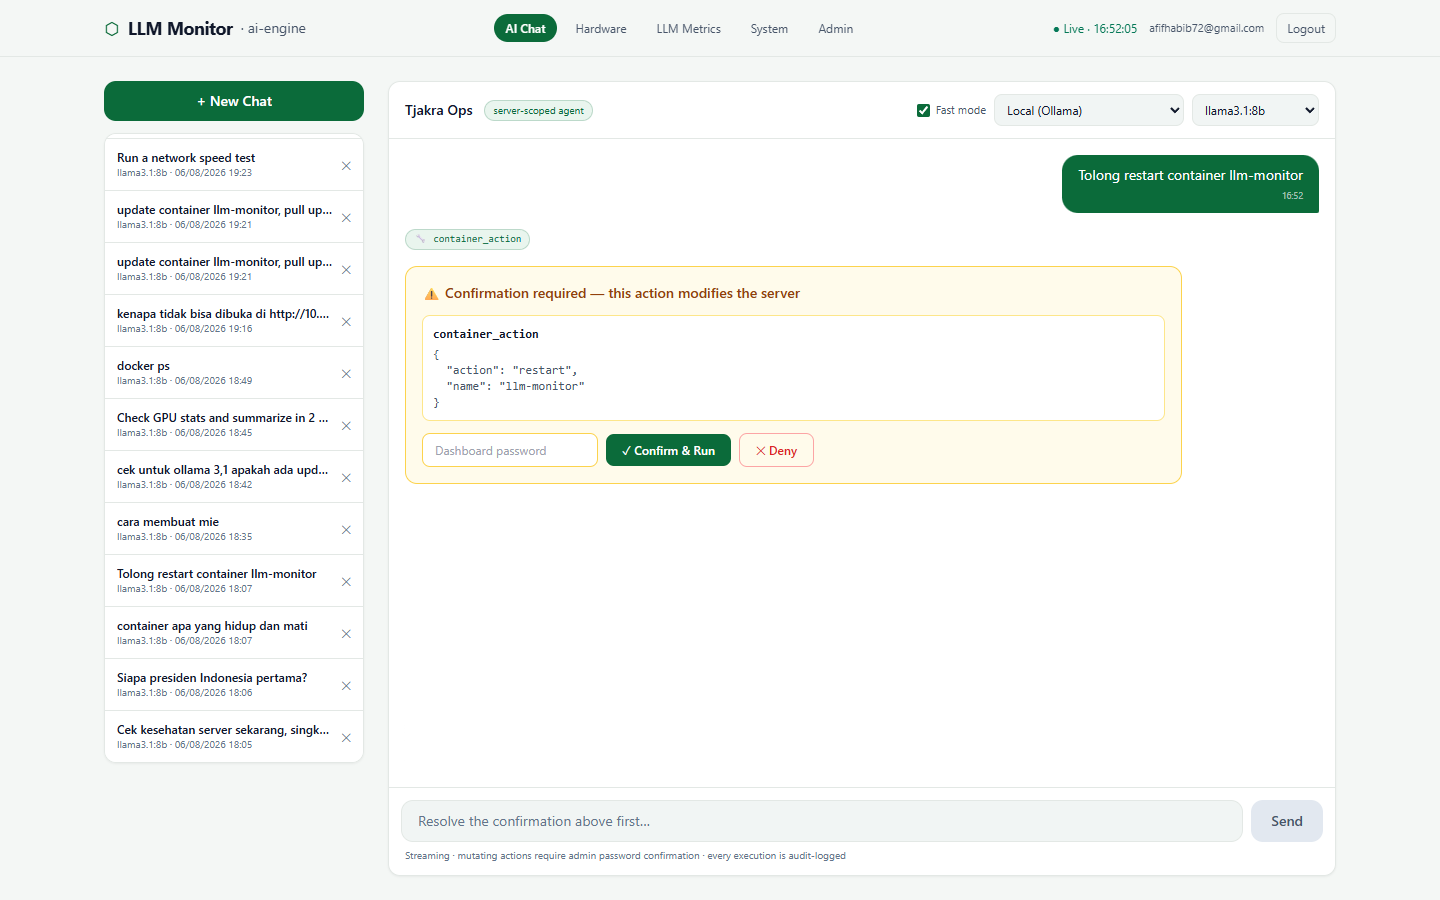
Every mutating tool pauses and shows the exact call with its arguments
Running it requires the dashboard password — plus a 2FA code when enabled
Deny cancels the action and tells the agent the user refused
Approved commands stream live output into an in-page terminal
Logins, container actions, model ops and approvals all land in the audit log
monitor.ai-engine/chat
Approval Gate & Audit Trail
(04)Feature

GPU Hardware Telemetry

Live NVIDIA metrics pulled straight from nvidia-smi over SSH
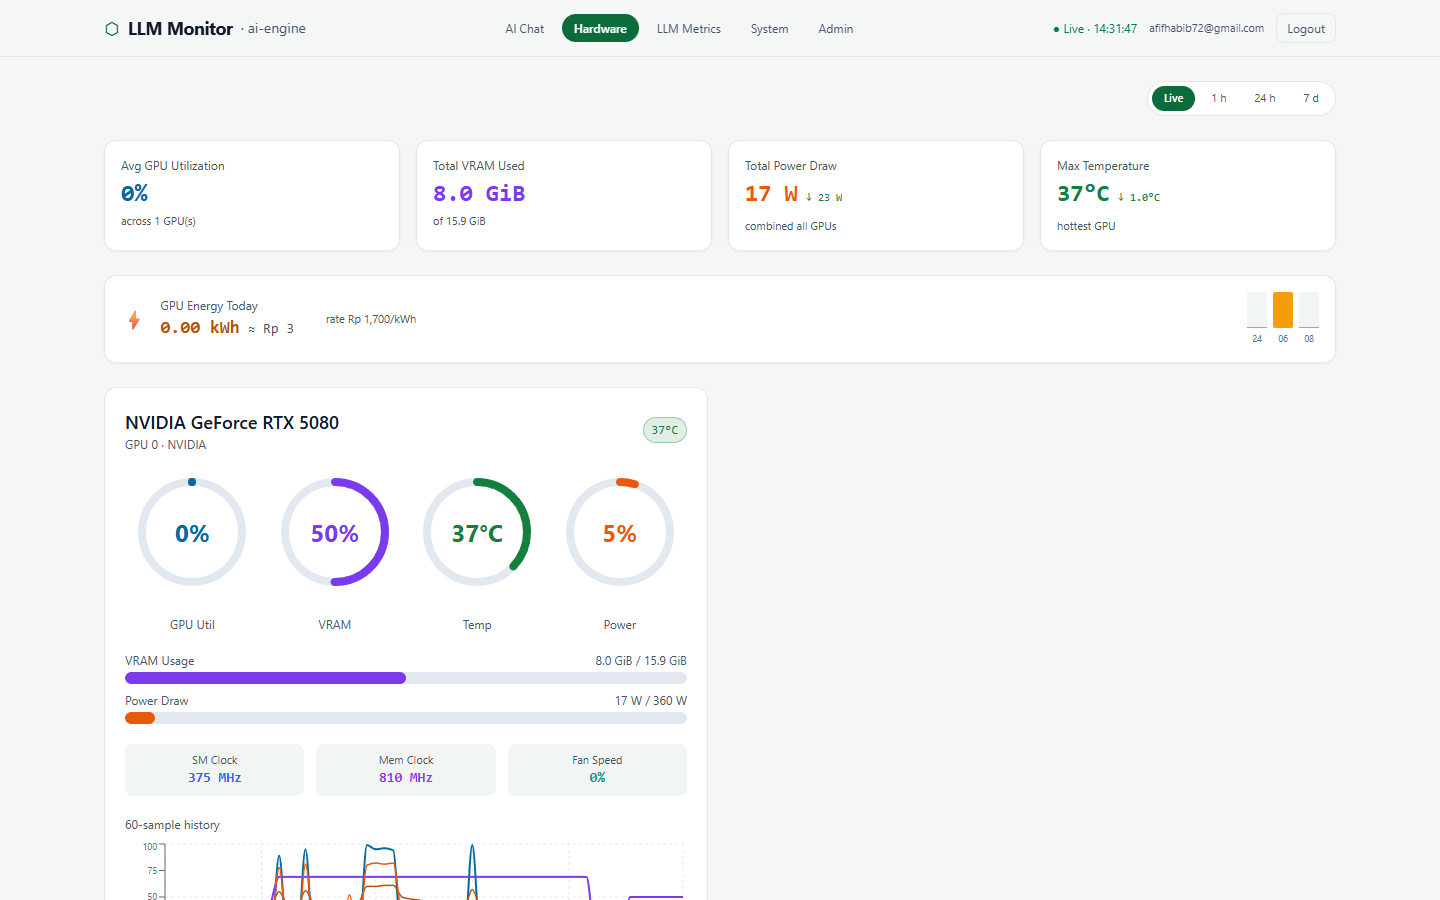
Utilization, VRAM, temperature and power gauges
SM / memory clocks and fan speed
Per-process VRAM attribution on the GPU
Trend arrows against the previous sample
Refreshes every 5s, pushed instantly over SSE
monitor.ai-engine/
GPU Hardware Telemetry
(05)Feature

Metric History & Energy Cost

Persisted time-series that survives restarts, plus what the GPU actually costs to run
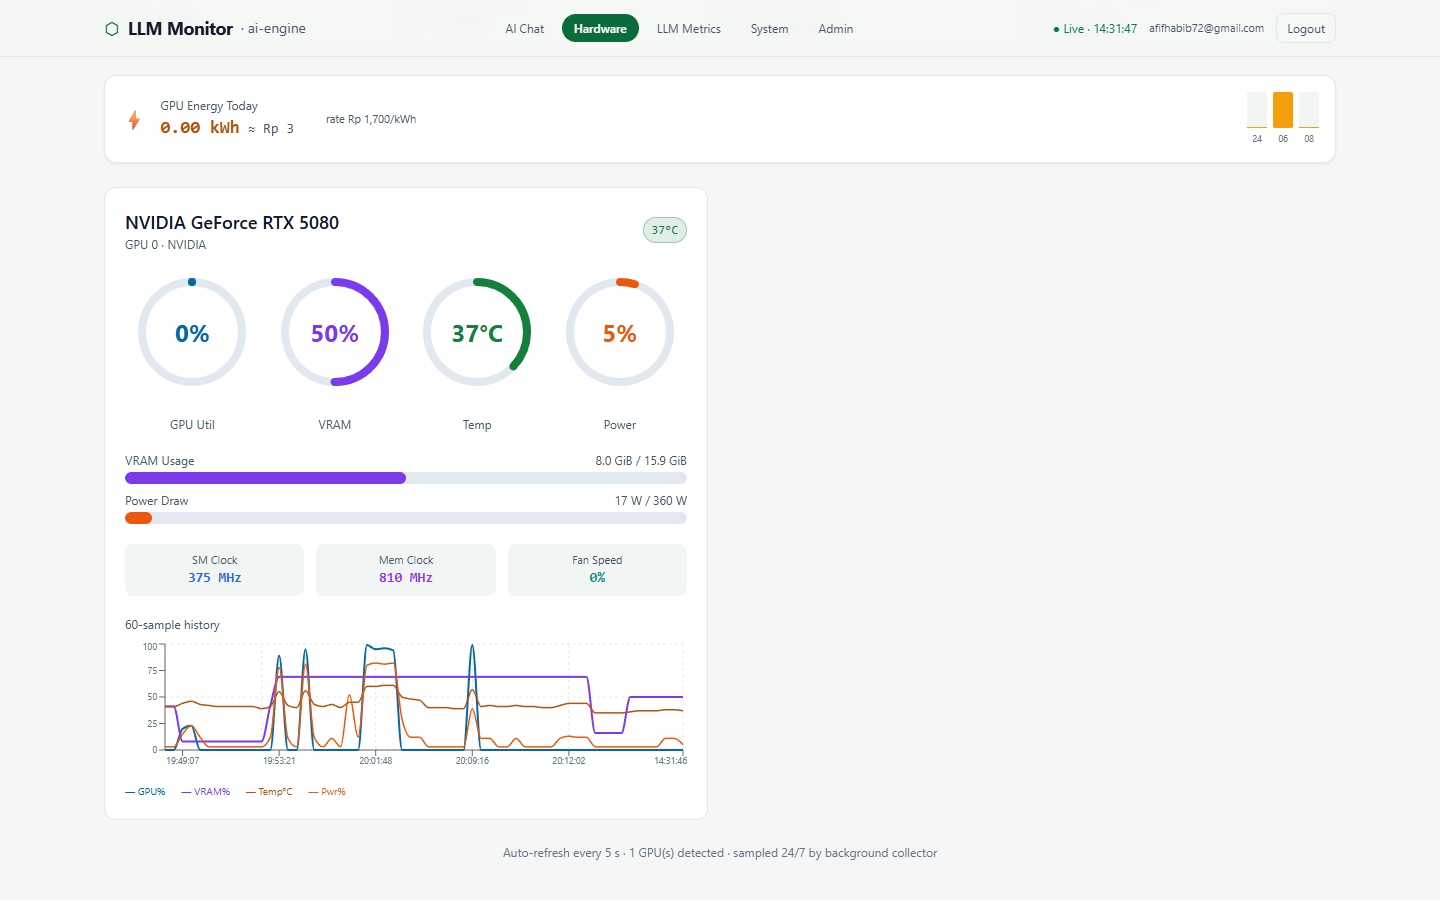
Live / 1h / 24h / 7d ranges with tiered downsampling
Raw → 1-minute → 5-minute averaging as the window widens
History persisted to a Docker volume, not just memory
Daily kWh and electricity cost estimated from power draw
monitor.ai-engine/?range=24h
Metric History & Energy Cost
(06)Feature

LLM Metrics & Live Traffic

What is loaded in VRAM right now, and how every inference request is performing
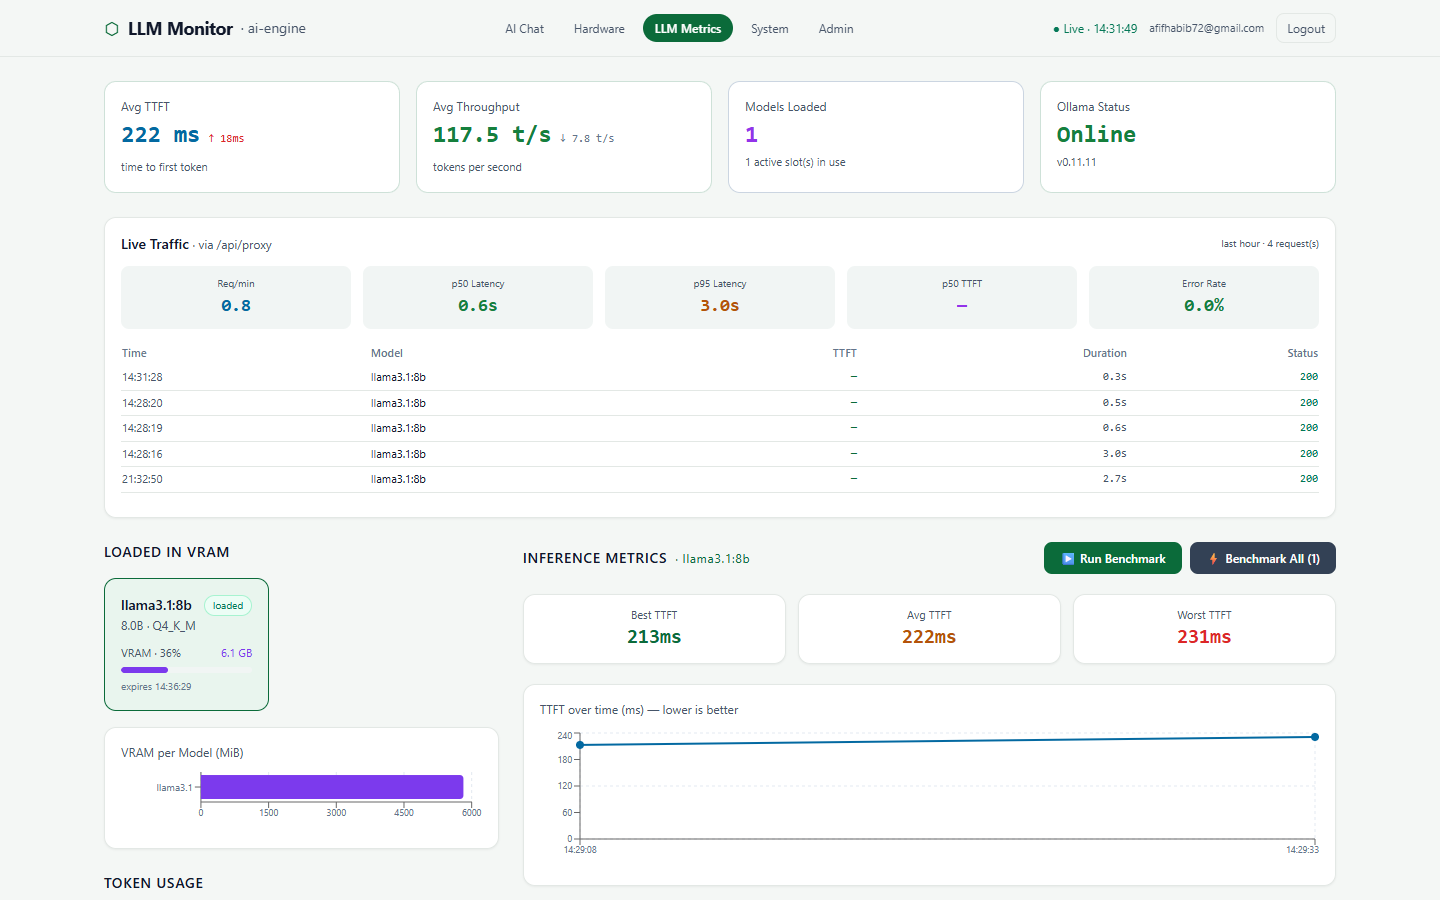
Models resident in VRAM with size, quantization and expiry
Req/min, p50 & p95 latency, p50 TTFT and error rate
Rolling table of the most recent inference calls
Ollama reachability and version at a glance
monitor.ai-engine/llm
LLM Metrics & Live Traffic
(07)Feature

Benchmarking & Model Comparison

Measure real first-token latency and throughput, then rank every loaded model
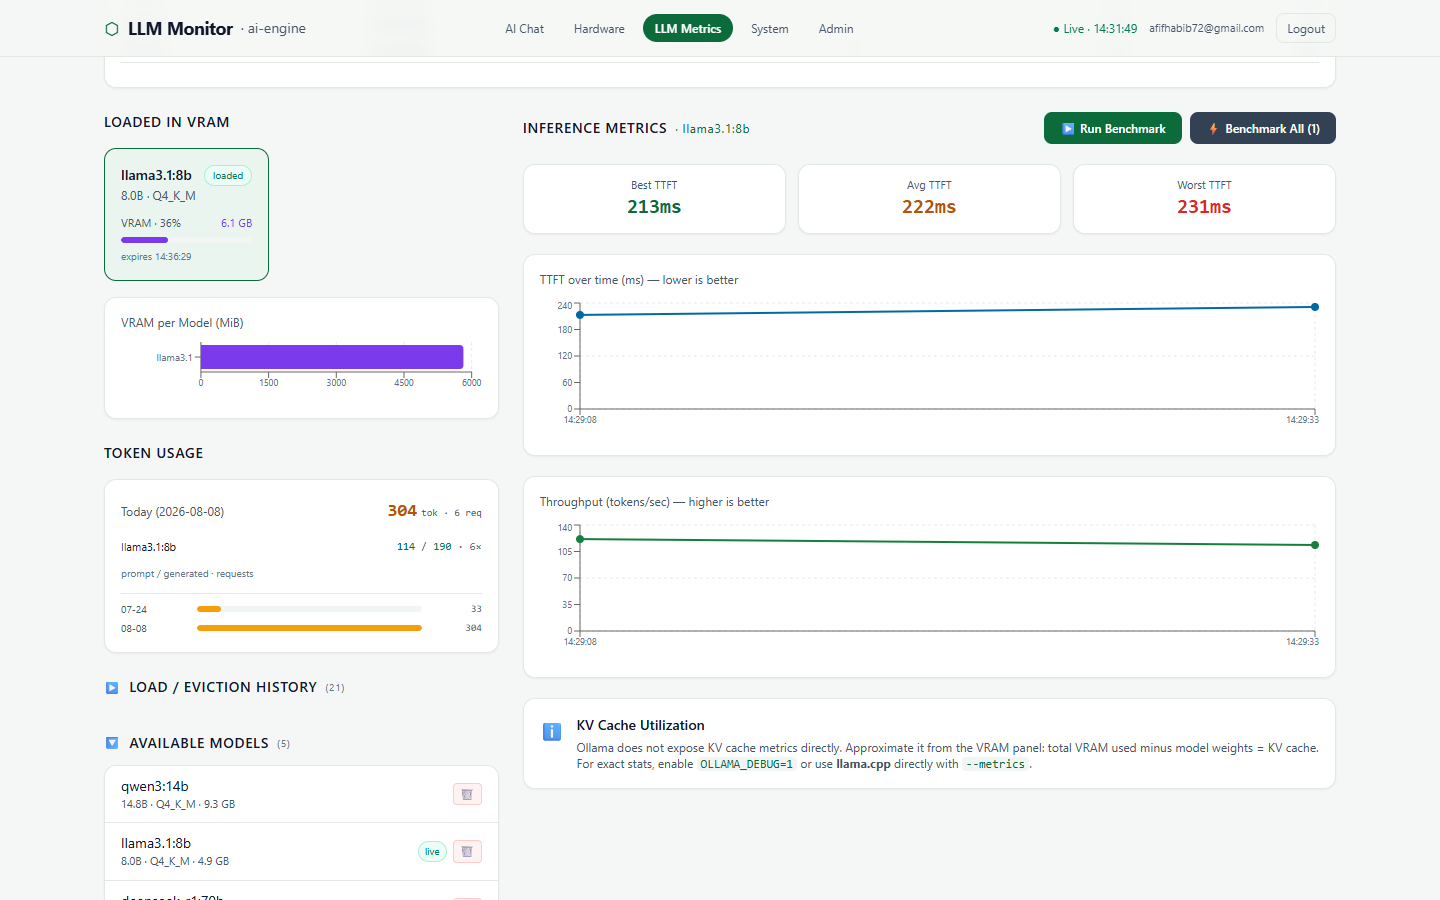
TTFT measured as true wall-clock, including load and queue time
Throughput in tokens/sec, charted over time
Benchmark All runs every loaded model and marks the winner
Daily benchmark trend — a >30% TTFT regression raises an alert
Requests clamped and rate-limited so benchmarks can't hog the GPU
monitor.ai-engine/llm
Benchmarking & Model Comparison
(08)Feature

Model Management & Token Accounting

Pull or delete models from the browser, and count every token that passes through
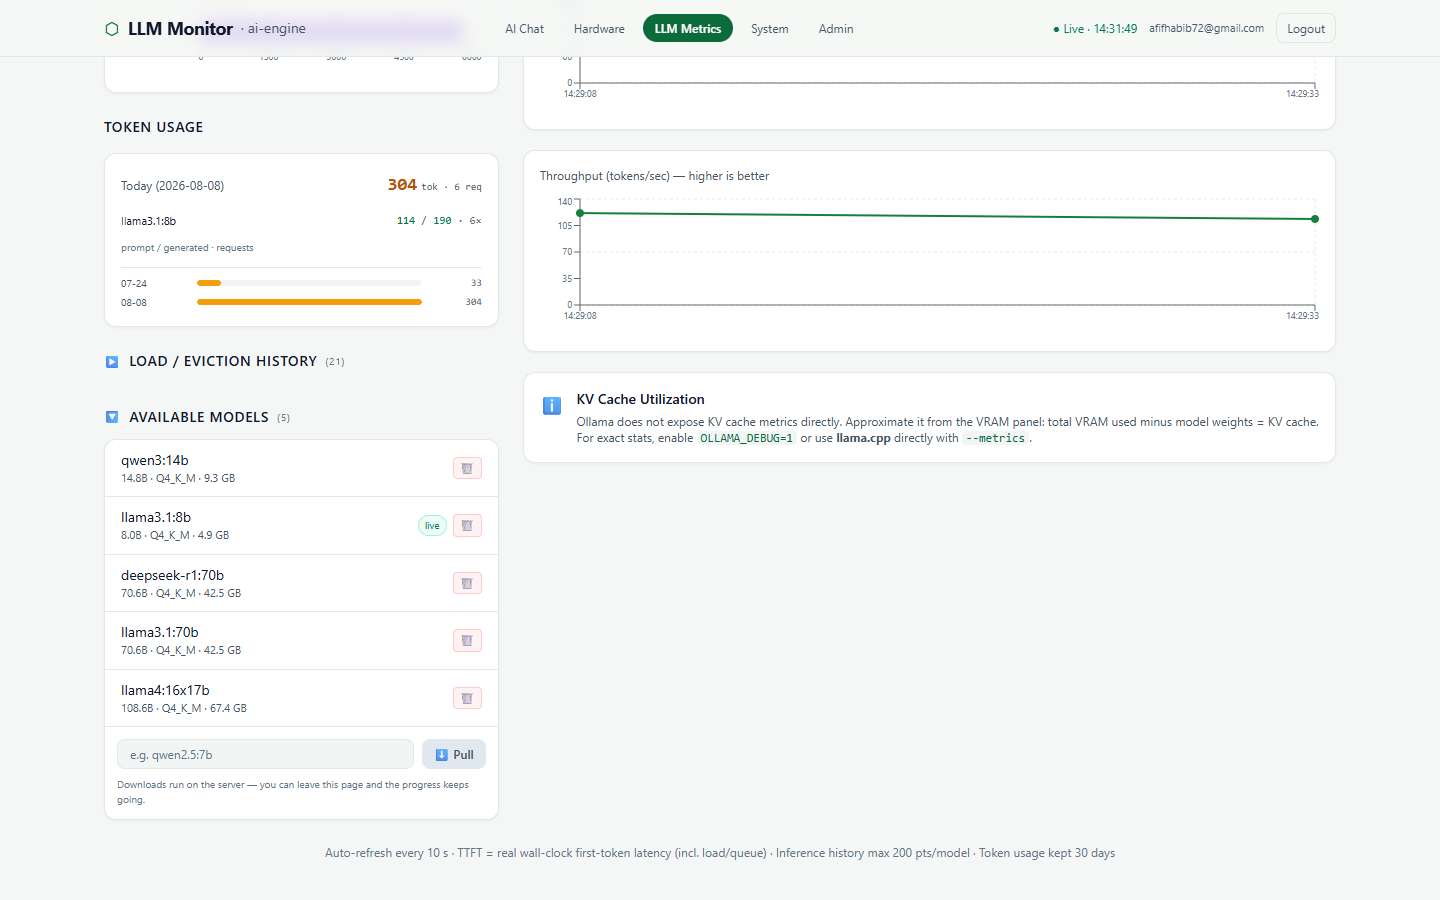
Pull models as a server-side job — progress survives a page reload
Delete models from server disk with confirmation
Token-counting proxy records prompt/generated tokens per model per day
30-day usage history with a daily breakdown
monitor.ai-engine/llm
Model Management & Token Accounting
(09)Feature

System Metrics

The whole host, not just the GPU — sampled continuously by a background collector
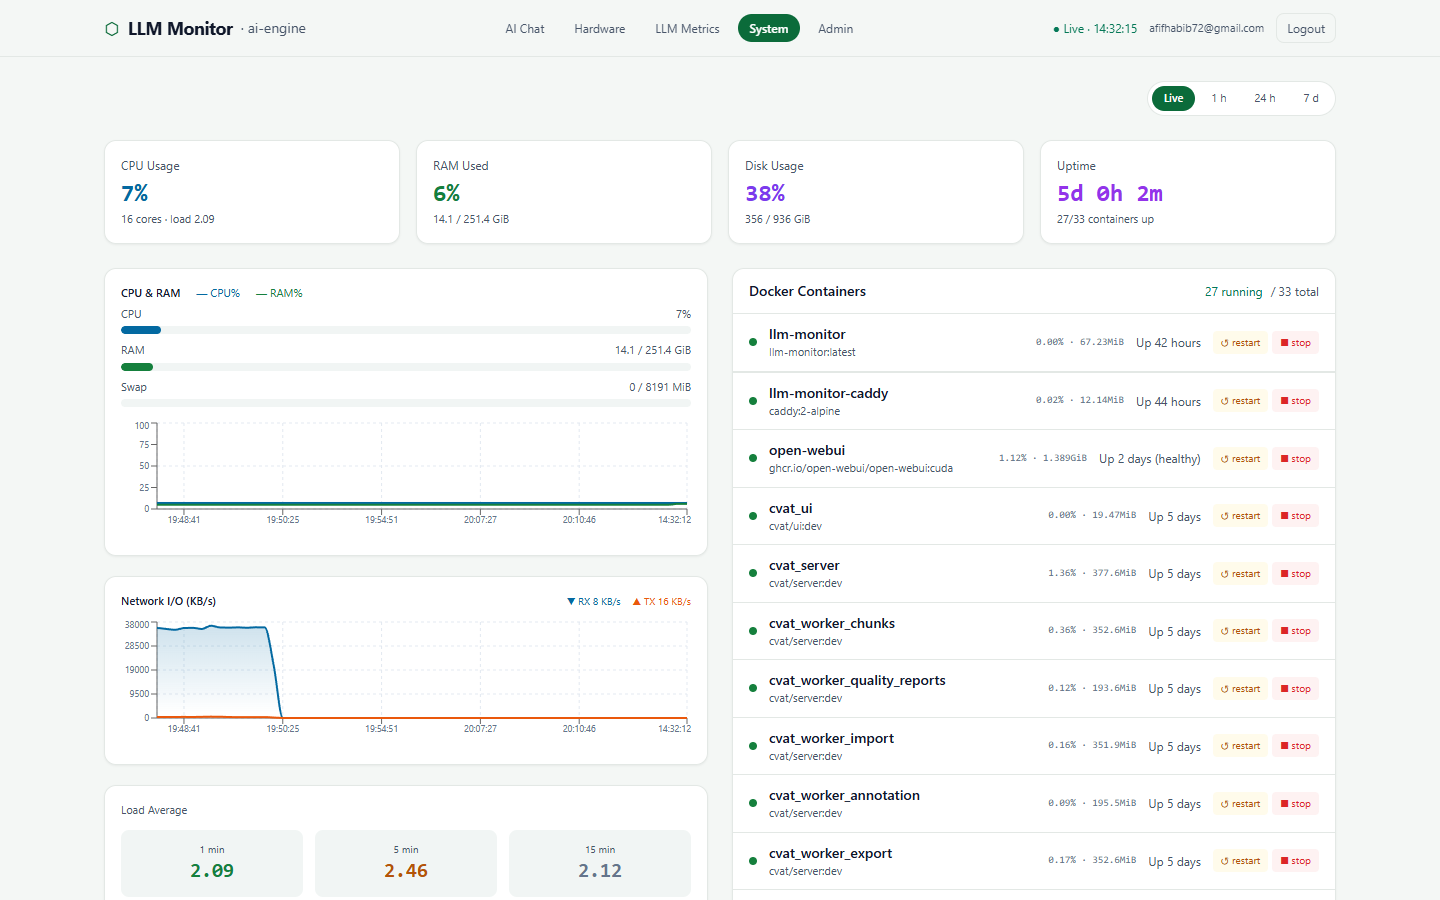
CPU, RAM, swap, disk and uptime with live progress bars
Network RX/TX throughput charted over the selected range
1/5/15-minute load average against core count
Disk-full prediction from the usage trend
monitor.ai-engine/system
System Metrics
(10)Feature

Docker Panel & Alerting

The manual counterpart to the agent — every container in one list, and a nudge when something breaks
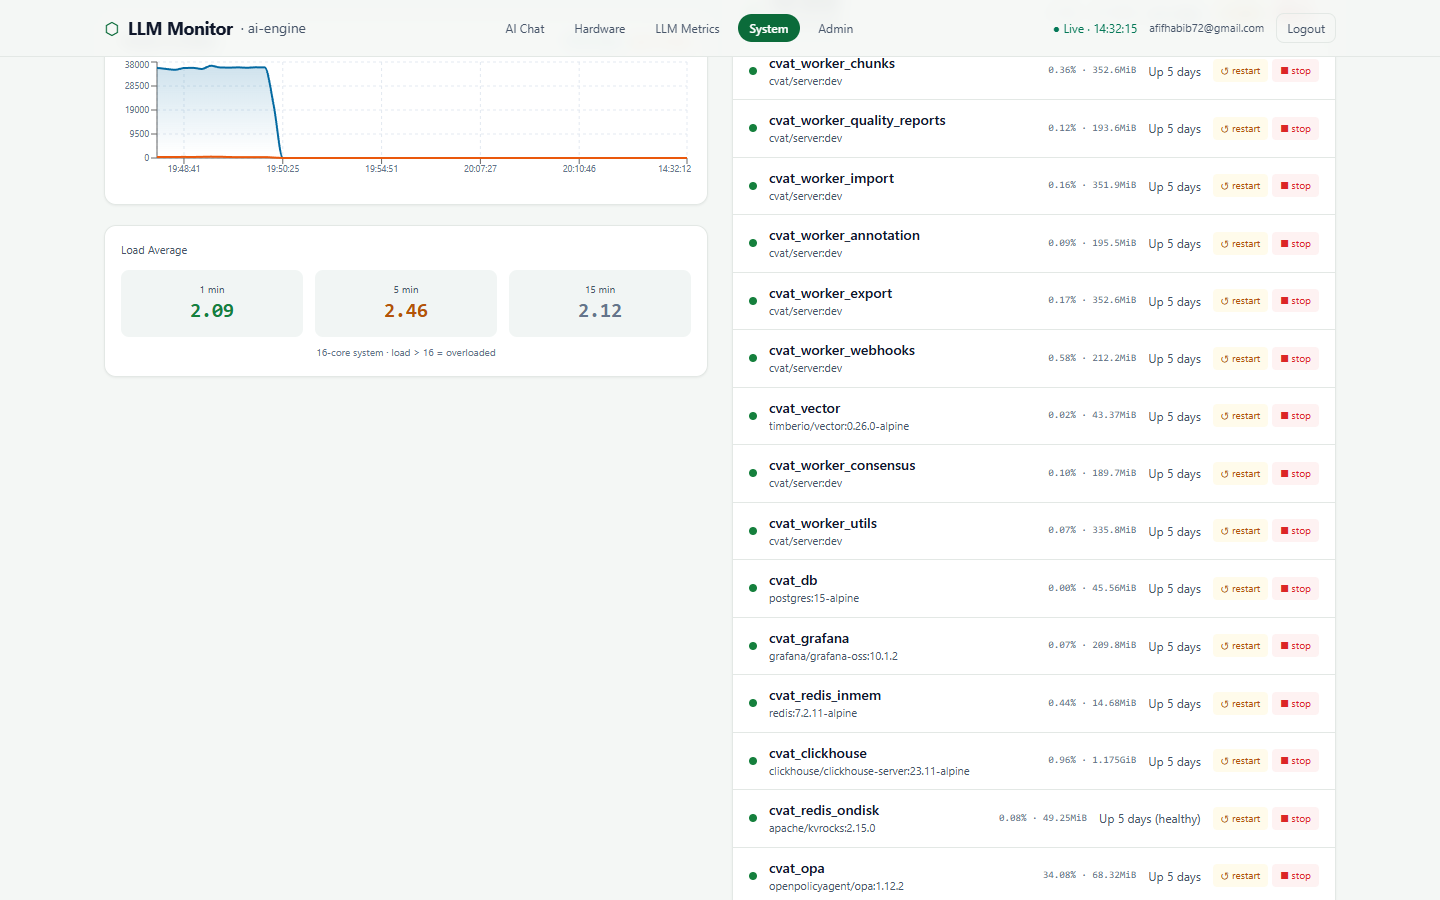
Every container with state, image, CPU and memory usage
Start / stop / restart actions straight from the row — no chat needed
Threshold alerts for GPU temp, VRAM, CPU, RAM and disk
Ollama-down detection with a recovery notification
Telegram alerts with 15-minute cooldown plus a daily summary
monitor.ai-engine/system
Docker Panel & Alerting
(11)Feature

Authentication & Access Control

Fail-closed auth built for a dashboard that is safe to expose publicly
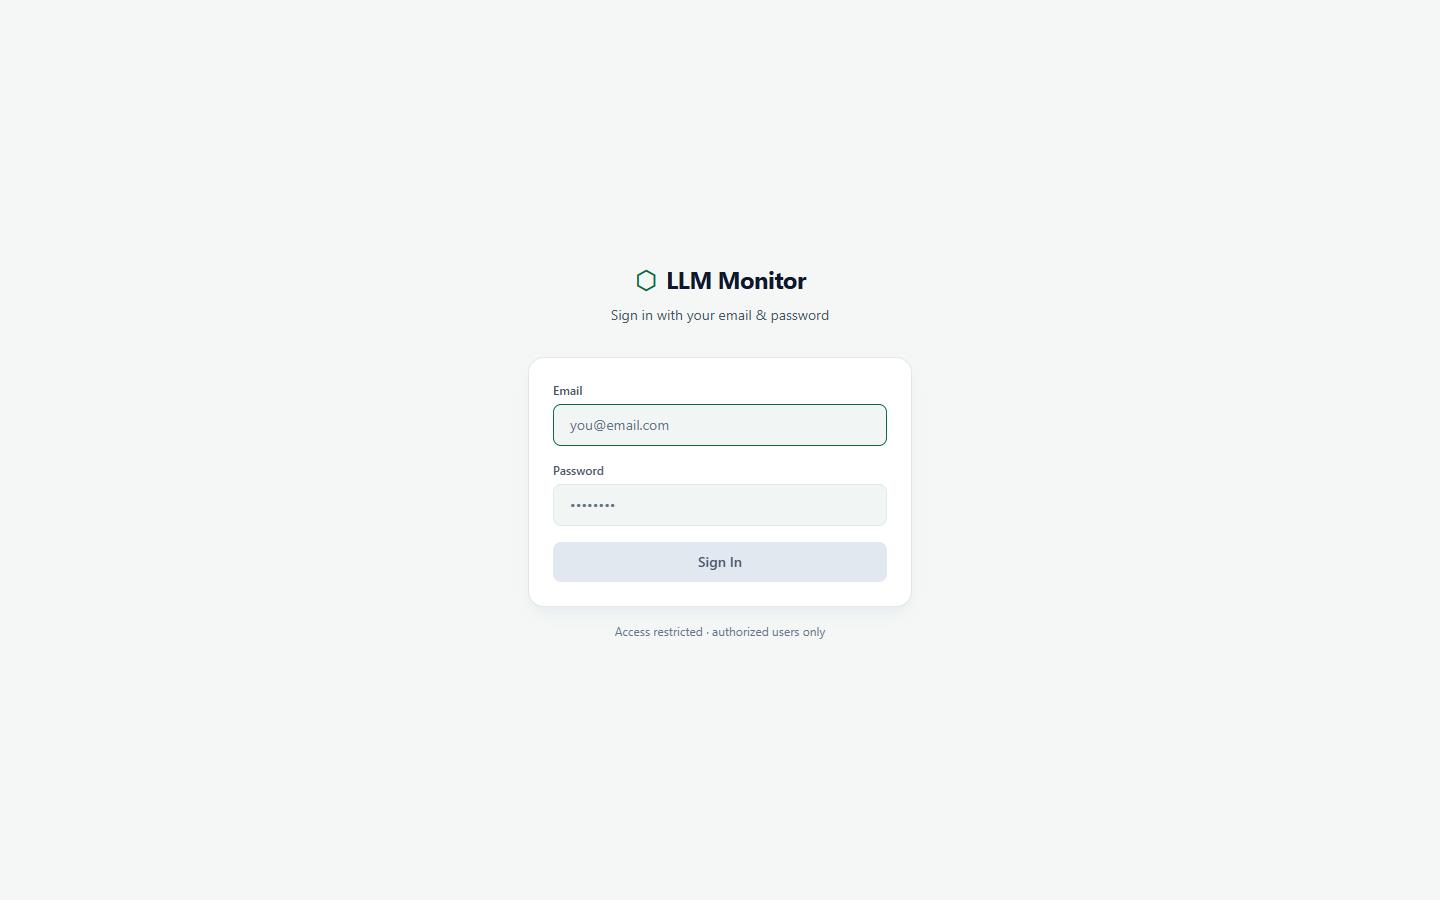
Email + password login with scrypt-hashed credentials
HMAC session cookie with a real 7-day expiry
Optional TOTP two-factor codes
Login rate-limited 5/min per real IP
Role-based access — admins can approve actions, viewers are read-only
monitor.ai-engine/login
Authentication & Access Control
(12)Feature

Admin Console

Users, thresholds, backups and a full audit trail in one place
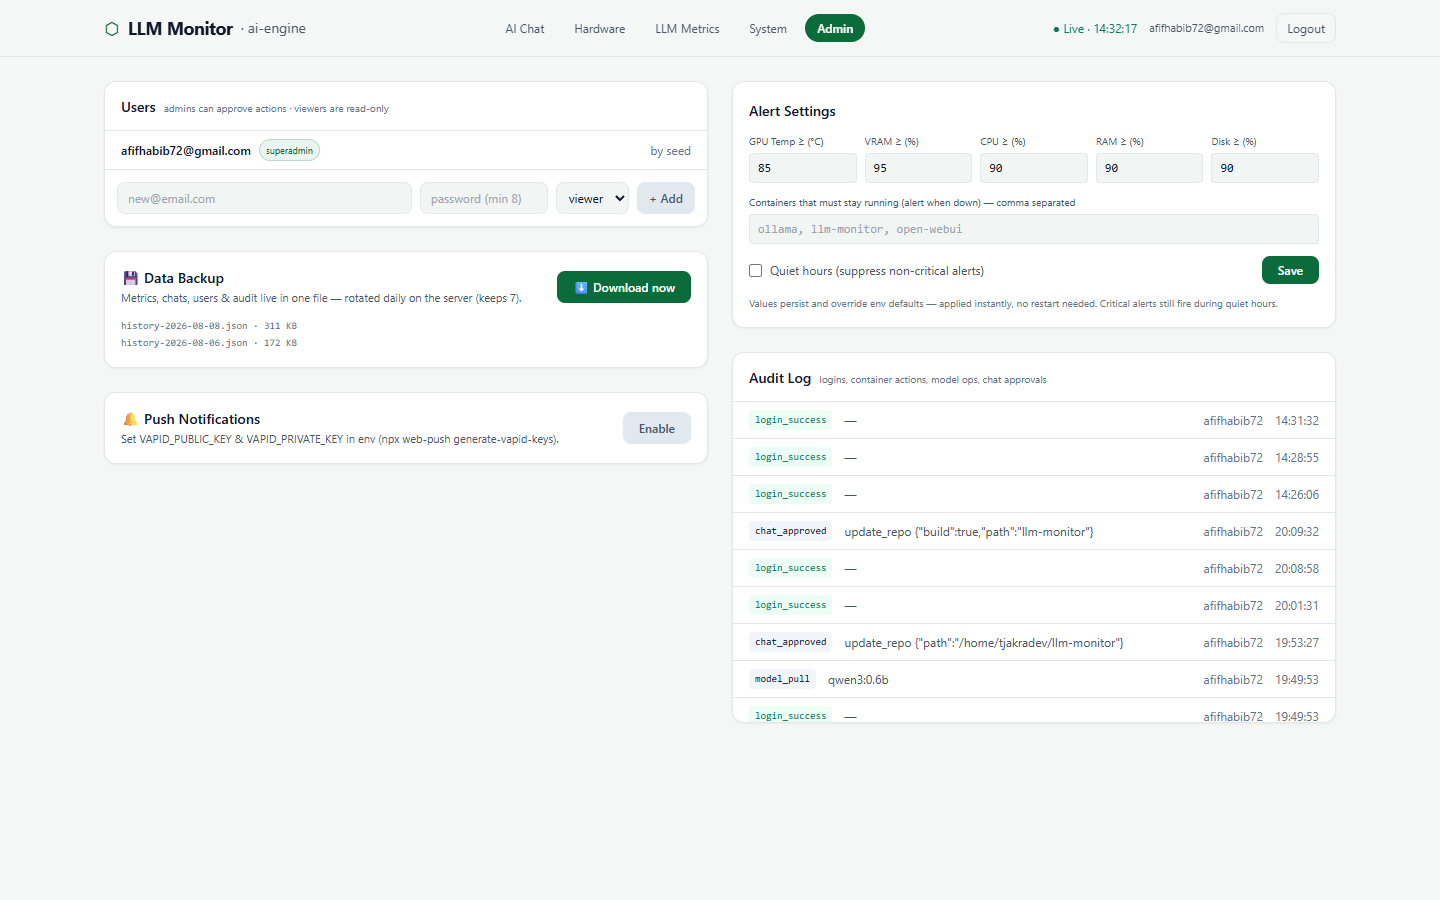
Add users and switch roles; the superadmin can't be demoted
Edit alert thresholds live — no restart, no redeploy
Quiet hours that suppress non-critical alerts
One-file data backup, rotated daily and downloadable
Audit log of logins, container actions, model ops and approvals
monitor.ai-engine/admin
Admin Console
(02)Tech Stack

Wired together withboring, solid tools.

Frontend

Next.js 16
React 19
TypeScript
Tailwind CSS
Recharts

Backend

Node.js
Route Handlers
Server-Sent Events
ssh2
Web Push

Infrastructure

Docker Compose
Caddy
Let's Encrypt
Named Volumes

AI & GPU

Ollama
nvidia-smi
Tool Calling
Streaming Inference

Integrations

Telegram Bot API
TOTP 2FA
JSON Persistence
Health Endpoint
(03) Running in Production

An agent withits hands on the box.

LLM Monitor runs on a private network in front of a real inference server. It deploys from GitHub, restarts containers and manages models on request — but every write stops at a confirmation card first, and every execution is logged.

Access
Private deployment